Table of contents
Multitasking? Listen while you work!
Your contact center generates thousands of data points every day: call volumes, wait times, resolution rates, customer satisfaction scores. Contact center performance metrics are not hard to find, but most organizations struggle to turn it into real improvement.
Metrics and Key Performance Indicators (KPIs) serve as your roadmap for evaluating and improving contact center performance.
Analytics turn raw numbers into actionable insights. Contact centers can diagnose problems, forecast demand, and adapt to changing customer expectations through systematic performance measurement.
Defining Contact Center Metrics and KPIs
Metrics and KPIs form the backbone of effective contact center strategy. Metrics are measurable data points that show performance in specific areas, such as Average Handle Time (AHT) or Call Volume. These foundational metrics act as health checks and show how well your contact center operates.
KPIs represent a subset of metrics directly tied to strategic goals. If improving customer loyalty is a priority, KPIs like Net Promoter Score (NPS) or First Call Resolution (FCR) become key focal points. Metrics reflect operational performance while KPIs translate those data points into actionable targets aligned with organizational objectives.
10 Essential Call Center KPIs & Performance Metrics
Understanding call center analytics requires tracking specific KPIs across multiple performance categories. These essential metrics help businesses deliver exceptional customer service.
1. First Call Resolution (FCR)
Percentage of customer issues resolved during the first interaction.
2. Net Promoter Score (NPS)
Likelihood of customers recommending your service. Usually self-assessed by callers, on a scale of 1-10.
3. Call Abandonment Rate
Percentage of customers who disconnect before reaching an agent. Target: Below 5%. Monitor continuously to identify queue management issues.
4. Transfer Rate
Percentage of calls requiring transfer to another agent or department.
5. Average Handle Time (AHT)
Total time agents spend on customer interactions including talk time, hold time, and after-call work. It’s important to balance efficiency with quality resolution.
6. Agent Utilization Rate
Percentage of time agents spend on productive activities.
7. Calls Handled Per Agent
Daily or hourly call volume per agent.
8. Cost Per Call
Total operational cost divided by call volume. Helps evaluate efficiency and identify cost reduction opportunities.
9. Occupancy Rate
Percentage of time agents spend handling calls versus waiting.
10. System Uptime
Percentage of time contact center systems remain operational. Target at least 99.9%.
Generating Key Metric Reports with Analytics Tools
Track the right metrics first. Then generate reports to further improve.
Microsoft Teams Reporting
Microsoft Teams offers built-in analytics dashboards that show high-level overviews of key metrics like call quality, duration, and participant count. These pre-configured reports identify trends and monitor basic performance indicators. The Microsoft Teams Call Quality Dashboard shows technical issues like dropped calls and network reliability.
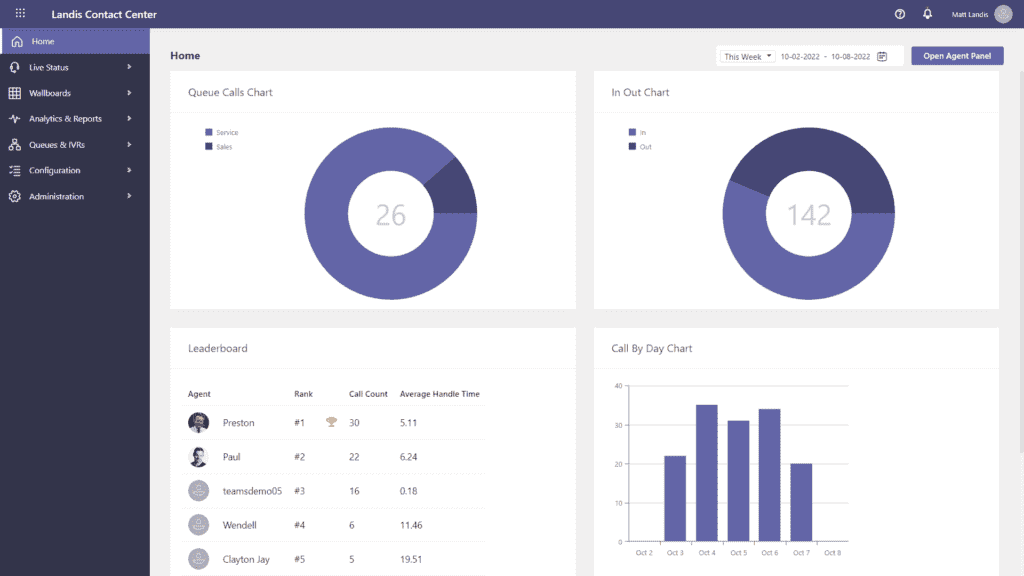
Landis Contact Center Analytics
For advanced reporting, Landis Contact Center for Microsoft Teams delivers real-time monitoring and customizable wallboards. These tools let managers track critical metrics in real time. Live dashboards help managers respond quickly to issues like queue bottlenecks or missed service level targets.
Also read: How ImageTrend improved their contact center reporting.
Power BI Integration
For organizations wanting advanced visualization, integrating Power BI with Microsoft Teams data offers great flexibility. Power BI creates custom dashboards tailored to specific organizational goals, such as improving Net Promoter Scores (NPS) or reducing Average Handle Time (AHT).
Practical Steps for Analytics Implementation
Setting KPIs
Key Performance Indicators should directly align with your organization’s strategic objectives. A sales-driven contact center might prioritize metrics like Conversion Rate and Cost Per Call. A customer service-focused center might focus on First Call Resolution (FCR) and Customer Satisfaction (CSAT).
Optimizing Agent Performance
Analytics help identify areas for agent improvement and recognition. Metrics like Average Handle Time (AHT), schedule adherence, and call quality scores help managers design targeted training programs that address specific weaknesses.
Improving Customer Experience
Analytics unlock deep insights into customer preferences, frustrations, and behavior. Sentiment analysis and post-call surveys highlight recurring pain points that need attention.
Turning Data into a Competitive Advantage
Metrics and KPIs serve as cornerstones of successful contact center strategy. They provide insights needed to achieve operational excellence, deliver great customer satisfaction, and maintain strategic goal alignment.
Operational excellence happens when contact centers use metrics to optimize resource allocation, improve agent productivity, and address performance bottlenecks. Metrics like Average Handle Time (AHT) and First Call Resolution (FCR) identify improvement areas. Managers can refine processes and reduce costs without compromising service quality.
Tools like Microsoft Teams and Landis Contact Center change how organizations leverage data. Their advanced analytics, real-time reporting, and integration with tools like Power BI help contact centers act quickly on insights.
Ready to elevate your contact center performance with Microsoft Teams-native analytics? Landis Contact Center delivers real-time insights, customizable dashboards, and seamless Microsoft Teams integration.